Detecting Mesoderm Invagination
Calculate the time when mesoderm invagination occurs in order to align samples in time and to start point tracking at the start of germband invagination
import numpy as np
import pandas as pd

import matplotlib
matplotlib.use('agg')
import matplotlib.pyplot as plt

import tifffile
import av

import tqdm

import gbeflow
fs = ['20180108_htl_glc_sc11_mmzm_rotate_brt',
 '20180108_htl_glc_sc2_mmzm_wp_rotate_brt',
 '20180108_htl_glc_sc9_mmzp_rotate_brt',
 '20180110_htl_glc-CreateImageSubset-01_sc10_wt_rotate_brt',
 '20180110_htl_glc-CreateImageSubset-02_sc11_htl_rotate_brt',
 '20180110_htl_glc_sc14_mmzp_rotate_brt',
 '20180110_htl_glc_sc15_mmzm_rotate_brt',
 '20180110_htl_glc_sc6_mmzm_rotate_brt',
 '20180112_htlglc_tl_sc11_mmzp_rotate_brt',
 '20180112_htlglc_tl_sc4_resille_rotate_brt']
Select a single sample as a test case
f = '20180110_htl_glc_sc14_mmzp_rotate_brt'
Load vector data and movie mesoderm_figs/output
# vimg = gbeflow.load_avi_as_array(f+'.avi')
vf = gbeflow.VectorField(f)
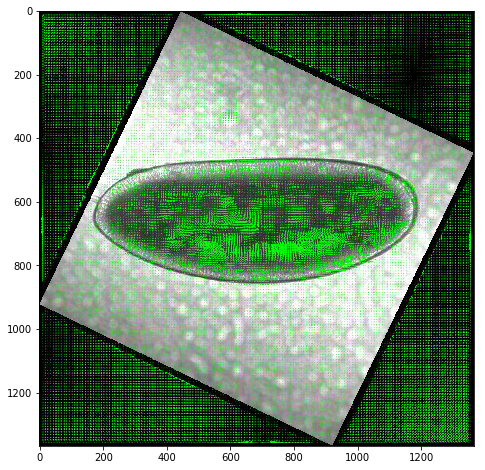
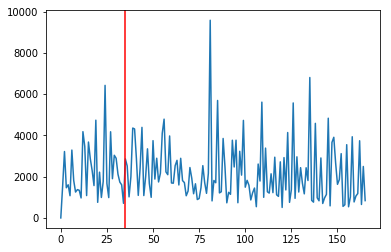
expected = 35
fig,ax = plt.subplots(figsize=(10,8))
ax.imshow(vimg[expected])
Test metrics for detecting mesoderm invagination
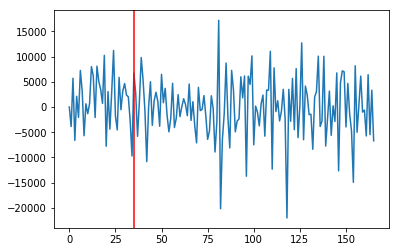
Sum of y component of vectors over time
vf.vy.shape
(166, 270, 270)
ysum = np.sum(vf.vy,axis=(1,2))
fig,ax = plt.subplots()
ax.plot(ysum)
ax.axvline(expected,c='r')
<matplotlib.lines.Line2D at 0x109358d30>
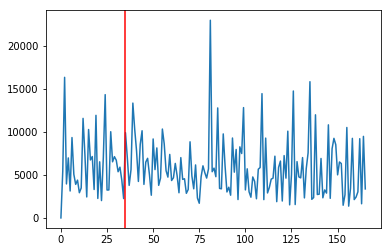
Try looking at the sum of only positive vy components
vfpos = np.copy(vf.vy)
vfpos[vfpos<0] = 0
ysum = np.sum(vfpos,axis=(1,2))
fig,ax = plt.subplots()
ax.plot(ysum)
ax.axvline(expected,c='r')
<matplotlib.lines.Line2D at 0x1d21e1fc50>
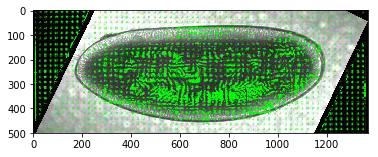
What about within an roi
roi = np.s_[:,400:900,:]
fig,ax = plt.subplots()
ax.imshow(vimg[roi][35])
<matplotlib.image.AxesImage at 0x11579f0b8>
np.interp(a, (a.min(), a.max()), (-1, +1))
roirange = np.interp([400,900], (0,1368), (0,270))
roirange
array([ 78.94736842, 177.63157895])
vroi = np.s_[:,int(roirange[0]):int(roirange[1]),:]
vfpos[vroi].shape
(166, 99, 270)
ysum = np.sum(vfpos[vroi],axis=(1,2))
fig,ax = plt.subplots()
ax.plot(ysum)
ax.axvline(expected,c='r')
<matplotlib.lines.Line2D at 0x1d239af9e8>
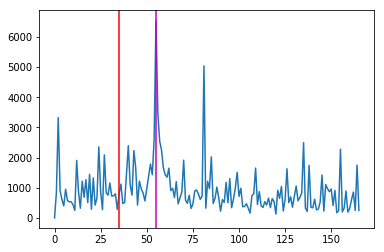
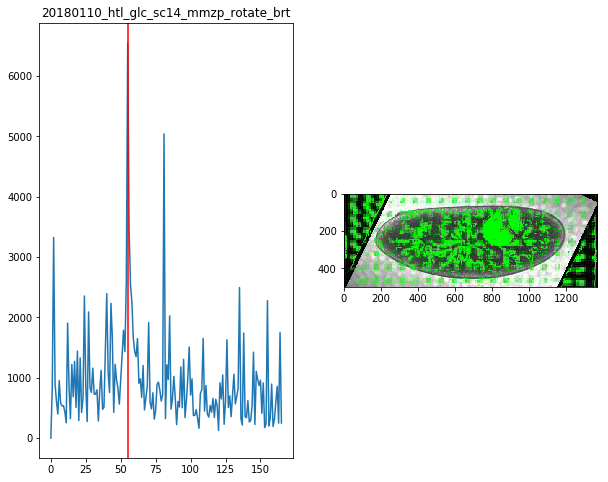
Sum of the squared positive vy
ysum = np.sum(np.power(vfpos[vroi],2),axis=(1,2))
fig,ax = plt.subplots()
ax.plot(ysum)
ax.axvline(expected,c='r')
ax.axvline(55,c='m')
<matplotlib.lines.Line2D at 0x1d24b19eb8>
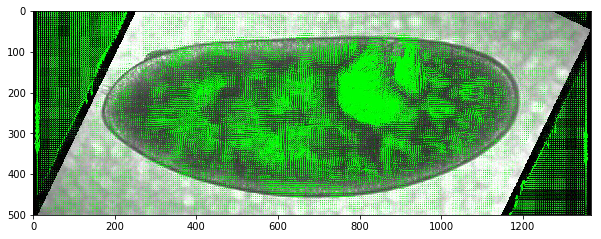
fig,ax = plt.subplots(figsize=(10,8))
ax.imshow(vimg[roi][55])
<matplotlib.image.AxesImage at 0x1d24c678d0>
While we are not detecting mesoderm invagination here, this feature does mark germband extension which could be useful in itself.
Let’s try this on other samples to see if the feature is consistent
Dvimg = {}
for f in fs:
    try:
        Dvimg[f] = gbeflow.load_avi_as_array(f+'.avi')
    except:
        print('Video import failed',f)
Dvf = {}
for f in Dvimg.keys():
    try:
        Dvf[f] = gbeflow.VectorField(f)
    except:
        print('Import failed',f)
Dsum = {}
for f in Dvimg.keys():
    vfpos = np.copy(Dvf[f].vy)
    vfpos[vfpos<0] = 0
    Dsum[f] = np.sum(np.power(vfpos[vroi],2),axis=(1,2))
for f in Dsum.keys():
    fig,ax = plt.subplots(1,2,figsize=(10,8))
    ax[0].plot(Dsum[f])
    ax[0].axvline(maxsum[f],c='r')
    ax[0].set_title(f)
    ax[1].imshow(Dvimg[f][roi][maxsum[f]])
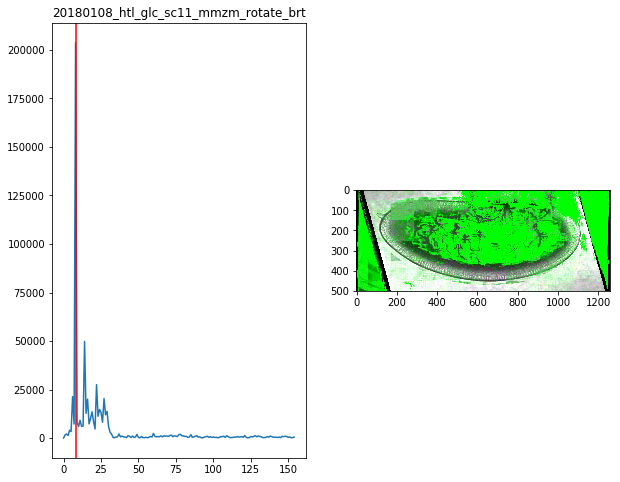
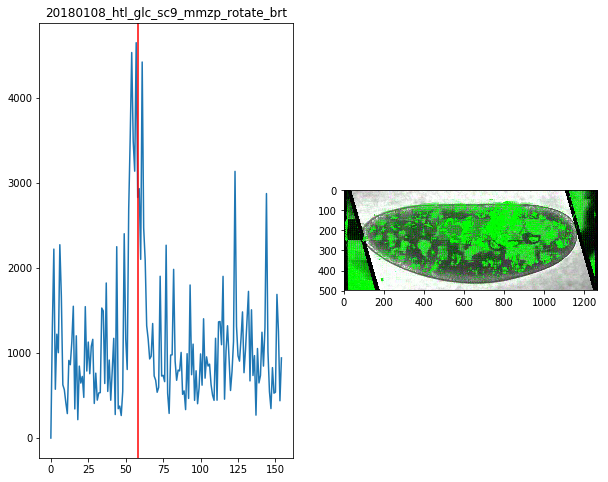
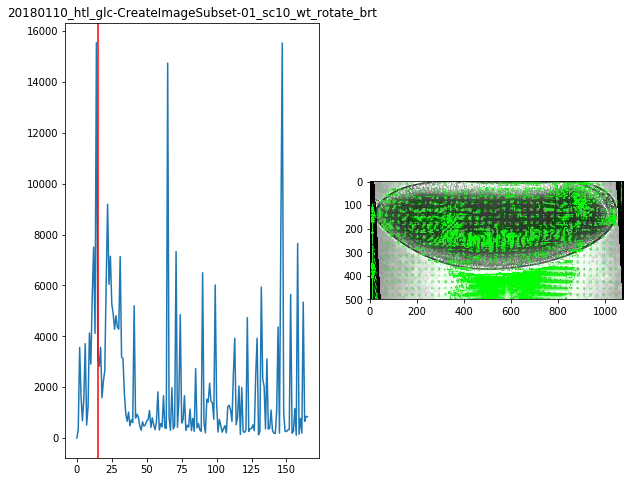
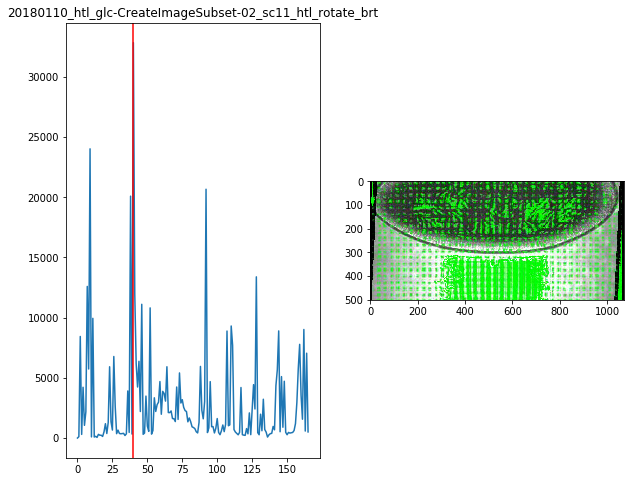
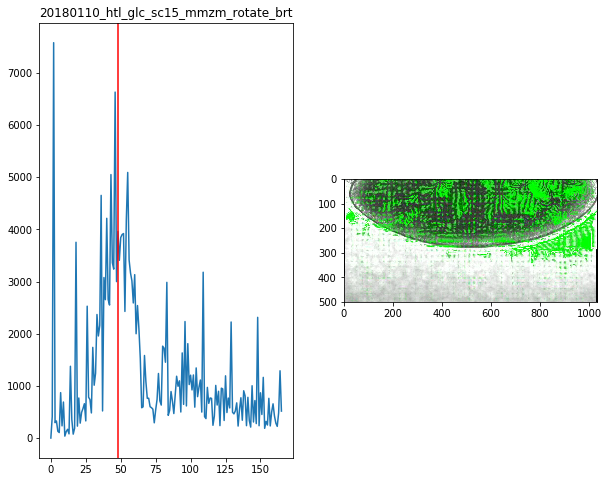
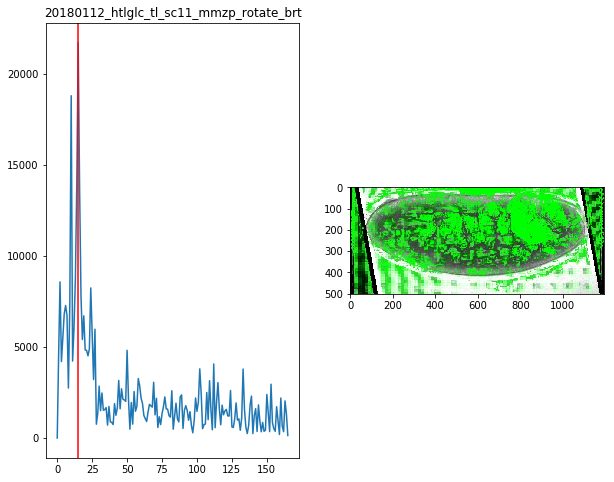
maxsum = {
    '20180108_htl_glc_sc11_mmzm_rotate_brt':8,
    '20180108_htl_glc_sc9_mmzp_rotate_brt':58,
    '20180110_htl_glc-CreateImageSubset-01_sc10_wt_rotate_brt':15,
    '20180110_htl_glc-CreateImageSubset-02_sc11_htl_rotate_brt':40,
    '20180110_htl_glc_sc14_mmzp_rotate_brt':55,
    '20180110_htl_glc_sc15_mmzm_rotate_brt':48,
    '20180112_htlglc_tl_sc11_mmzp_rotate_brt':15
}
For the time being it looks like manually selecting the timepoint of mesoderm invagination will be more expedient.
Check manual assignments
tpoints = pd.read_csv('mesoderm_invagination.csv')
tpoints
| File | Timepoint | |
|---|---|---|
| 0 | 20180110_htl_glc_sc14_mmzp_rotate_brt.avi | 36 |
| 1 | 20180108_htl_glc_sc9_mmzp_rotate_brt.avi | 36 |
| 2 | 20180108_htl_glc_sc11_mmzm_rotate_brt.avi | 62 |
| 3 | 20180110_htl_glc_sc15_mmzm_rotate_brt.avi | 41 |
| 4 | 20180110_htl_glc-CreateImageSubset-01_sc10_wt_... | 16 |
| 5 | 20180110_htl_glc-CreateImageSubset-02_sc11_htl... | 57 |
| 6 | 20180112_htlglc_tl_sc11_mmzp_rotate_brt.avi | 4 |
tpoints[tpoints['File']==f+'.avi'].values[-1,-1]
62
for f in Dvimg.keys():
    fig,ax = plt.subplots(figsize=(10,8))
    t = tpoints[tpoints['File']==f+'.avi'].values[-1,-1]
    ax.imshow(Dvimg[f][t])
    ax.set_title(f)
Test track interpolation starting at mesoderm invagination
tracks = pd.read_csv('20181128-tracking.csv')
tracks.head()
starts = tracks[tracks.t==0][['f','x','y']]
trange = range(maxsum[f],np.max(vf.tval))
(trange)
xpos = [x0]*(maxsum[f]+1)
ypos = [y0]*(maxsum[f]+1)
for t in trange:
    dx = vf.Ldx[t].ev(xpos[t],ypos[t])
    dy = vf.Ldy[t].ev(xpos[t],ypos[t])

    xpos.append(xpos[t] + dx*60)
    ypos.append(ypos[t] + dy*60)
track = np.array([xpos,ypos])
trackdf = pd.DataFrame({'x':track[0,:],'y':track[1,:],'t':vf.tval,
                        'track':[i]*track.shape[-1],
                        'name':['test']*track.shape[-1]})
Track visualization
tracks = pd.concat(Ltrack,keys=list(Dvf.keys())
                  ).reset_index(
                  ).drop(columns=['level_1']
                  ).rename(columns={'level_0':'file'})
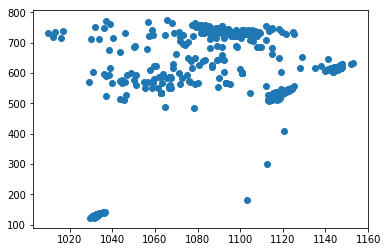
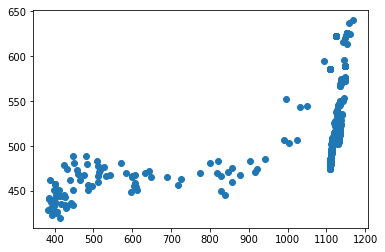
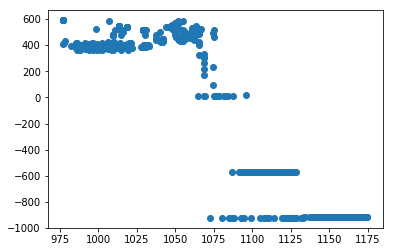
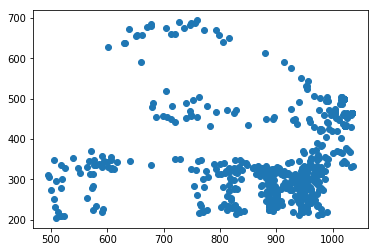
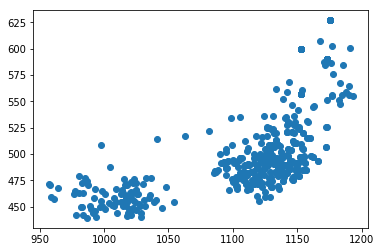
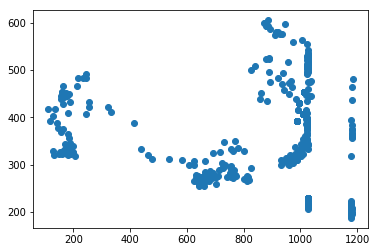
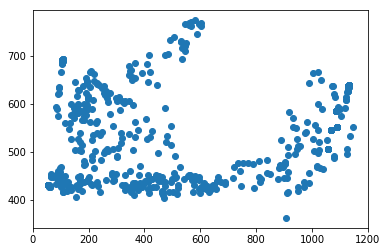
for f in tracks['file'].unique():
    fig,ax = plt.subplots()
    sb = tracks[tracks['file']==f]
    ax.scatter(sb.x,sb.y)#,c=sb.t,cmap='plasma')
for f in tracks['file'].unique():
    gbeflow.make_track_movie(Dvimg[f],tracks[tracks.file==f],c='r',
                            name='20181202_'+f+'_tracks')
Attempting to start interpolating the tracks at the time of mesoderm invagination does not appear to improve the results of the tracking since there is still a large fraction that wanders out of the frame entirely.